
Technical debt is the only financial metaphor in software that developers use constantly and finance teams ignore completely.
This is partly because engineers tend to describe it in ways that are impossible to act on: "the codebase is a mess", "we'll have to rewrite this eventually", "it's held together with duct tape". None of these statements help a CTO decide whether to delay a feature sprint, and none of them help a CEO understand why the development team moves slower every quarter.
The problem is measurement. What gets measured gets managed. What doesn't gets accumulated.
What Technical Debt Actually Is
Ward Cunningham coined the metaphor in 1992: technical debt is the accumulated cost of decisions made to ship faster, where the interest is paid every time you work in that area of the code.
There are three types that matter in practice:
Intentional debt - you knew the shortcut was a shortcut when you took it. "We'll use a direct SQL query for now and add the ORM later." This is legitimate if the trade-off was deliberate and documented.
Unintentional debt - the code was written without knowing there was a better approach. A developer used blocking I/O because they were not yet familiar with async patterns. This is a knowledge gap, not a moral failure.
Bit rot - the code was fine when written, but the ecosystem moved on. That PHP 5.6 codebase was modern in 2015. It is liability in 2026. No one is to blame; time passed.
Understanding which type you have changes how you fix it. Intentional debt has clear owners and known scope. Bit rot often requires a full dependency audit before the scope is clear.
The Metric Framework
Stop trying to assign a single number to "total technical debt". It is not useful. Instead, track four signals:
1. Deployment Frequency and Lead Time
These are the most honest proxies for structural code health. Teams with high technical debt deploy less often because:
- Tests are unreliable so they batch changes to reduce risk
- Dependencies between modules mean small changes have large blast radii
- Confidence is low, so code spends longer in review and staging
Track these with your CI/CD system. If lead time (commit to production) is longer than 3 days for a two-line bug fix, you have a structural problem.
2. Change Failure Rate
What percentage of deployments require a hotfix within 24 hours? According to the DORA State of DevOps research, a healthy team is below 5% and elite teams achieve below 1%. Teams with high debt are often at 15-25%.
This metric is uncomfortable to measure because it forces an honest accounting of what constitutes a "failure" - but that discomfort is the point.
3. Bug Recurrence by Module
Export your issue tracker's data from the past 12 months and group bugs by the file or module they touched. You will find that 20% of your codebase generates 80% of your bugs. This is Pareto, and it is extraordinarily reliable in practice.
These hot spots are your highest-interest debt. They are the code you touch most often and break most often. Paying down debt here has an immediate, measurable payoff in reduced support time.
# Git shortcut: find files with the most bug-fix commits in the past year
git log --since="1 year ago" --grep="fix\|bug\|hotfix" --name-only --format="" \
  | sort | uniq -c | sort -rn | head -20
This takes 30 seconds to run and surfaces your top 20 problem files. It is not a perfect signal, but it is a real one.
4. Complexity Score per Module
Cyclomatic complexity measures the number of linearly independent paths through a piece of code. High complexity correlates with defect density and difficulty of change.
Run a static analysis tool on your codebase:
- PHP:
phpstan,psalm, orphplocfor complexity metrics - JavaScript/TypeScript:
eslintwithcomplexityrule, orplato - Java:
checkstyle,PMD
The raw numbers matter less than the trend. Is average complexity per file increasing or decreasing quarter over quarter? A rising trend means debt is accumulating faster than you are paying it down.
Making the Business Case
Technical debt conversations fail when they stay in engineering language. "We need to refactor the order processing module" lands differently than "bugs in order processing cost us 12 engineer-hours of hotfix work last quarter, and the lead time for adding new payment methods is 6 weeks instead of 3 days."
The thing is, "we need to refactor the order processing module" is a preference. "Bugs in order processing cost us 12 engineer-hours of hotfix work last quarter, and the lead time for adding new payment methods is 6 weeks instead of 3 days" is a cost - one a CFO can understand.
Stop framing refactoring as improvement. Debt is not paid once; it is paid every sprint you work in that area of the code. Make it concrete: "this module generated 8 bugs in 6 months - 24 hours of unplanned work at our blended rate is €3,600, and that is just last quarter."
The framing that lands is insurance, not improvement. "We want to refactor X" sounds optional. "Our current architecture cannot support the payment provider you want to add in Q3 without a 6-week migration - we can reduce that to 2 weeks if we do this work now" sounds like planning.
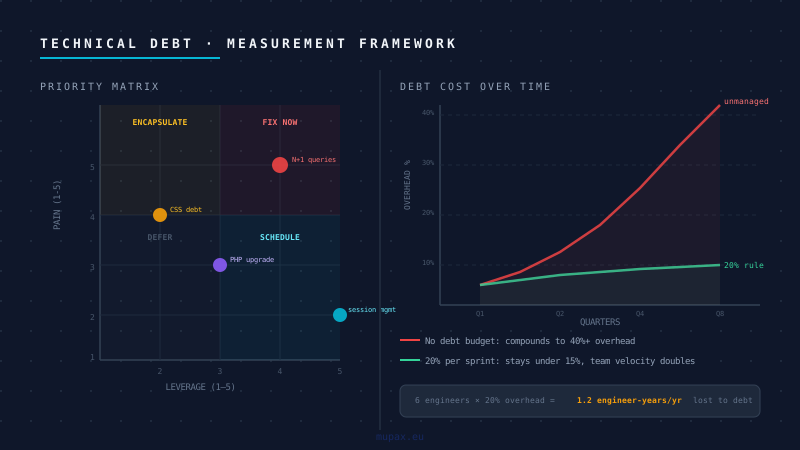
One more number worth showing: if a team of 6 engineers wastes 20% of their time on debt-related overhead, that is 1.2 engineer-years of lost capacity per year. Accumulated over three years without management, that becomes the reason the team is "always slow" - and by that point, the debt itself is invisible to everyone except the engineers.
A Practical Prioritization Matrix
Once you have measurement, prioritization is straightforward. Score each debt item on two axes:
- Pain (1-5): How often does working in this area slow the team down or cause bugs?
- Leverage (1-5): How much of the codebase or feature roadmap does fixing this unlock?
Items scoring 4+ on both axes go to the top of the backlog. Items scoring low on pain but high on leverage are worth scheduling for a quiet quarter. Items scoring high on pain but low on leverage may be better candidates for encapsulation - hide the mess behind an interface so it stops spreading, rather than rewriting it immediately.
| Debt Item | Pain | Leverage | Action |
|---|---|---|---|
| Order processing N+1 queries | 5 | 4 | Fix now |
| Session management in legacy module | 2 | 5 | Schedule Q3 |
| Outdated CSS framework | 4 | 2 | Encapsulate |
| PHP 7.4 deprecated functions | 3 | 3 | Batch with PHP 8 upgrade |
The Rule About Not Stopping
The worst response to high technical debt is a multi-month "debt sprint" with no feature delivery.
Stakeholder trust evaporates, business pressure accumulates, and when the sprint ends you are in the same situation - now with a mandate gone and a team that has been told twice that debt work will be properly funded.
Instead: 20% of every sprint, every week. Non-negotiable. Not "when we have time" - time is never found, it is allocated.
Teams that sustain this for two years consistently report that their deployment frequency doubles and their change failure rate halves. The compounding works in your favour.
If you need an independent assessment of where your codebase sits and a prioritized roadmap for paying it down, that is exactly what our Technical Audit service covers.
Frequently Asked Questions
What is technical debt in software development?
Technical debt is the accumulated cost of decisions made to ship faster, where interest is paid every time you work in that area of the code. It comes in three forms: intentional shortcuts taken knowingly, unintentional gaps caused by knowledge limitations, and bit rot where previously-acceptable code becomes a liability as the ecosystem evolves. The term was coined by Ward Cunningham in 1992.
How do you measure technical debt practically?
Track four signals: deployment lead time (commit to production), change failure rate (deployments requiring a hotfix within 24 hours), bug recurrence by module (which files generate the most incidents), and cyclomatic complexity trend per quarter. Together these give a management-ready picture without requiring an arbitrary single "debt score" that nobody acts on.
What is a healthy change failure rate for a software team?
According to DORA State of DevOps research, a healthy change failure rate is below 5% and elite teams achieve below 1%. Teams carrying significant technical debt typically sit at 15-25%. If more than one in ten deployments requires an emergency fix, there are structural problems in the codebase that measurement and prioritisation can address.
How much sprint capacity should go to paying down technical debt?
Allocate 20% of every sprint - not "when we have time", which in practice means never. Teams that sustain this consistently for two years report that deployment frequency doubles and change failure rate halves. A dedicated debt sprint lasting multiple months with no feature delivery erodes stakeholder trust and rarely produces durable results.
How do you make the business case for fixing technical debt?
Translate engineering language into financial cost. "We need to refactor the order module" is a preference. "Bugs in order processing required 24 hours of unplanned work last quarter at a cost of €3,600, and the feature your sales team needs will take 6 weeks instead of 2 because of the current architecture" is a cost a CFO can evaluate and approve.